
 Driving the anxiety and uncertainty about the current outbreak of COVID-19 is the case fatality ratio (CFR) being thrown about carelessly by not just the press, but also WHO and other organizations. However the CFR is not a one-size-fits all, and is influenced by many factors.
The case fatality ratio for a disease is the number of fatalities divided by the number of confirmed infections. The latter number is typically obtained by laboratory diagnosis, in the current outbreak via RT-PCR, which detects viral nucleic acids. As of this writing this ‘crude€™ global CFR for COVID-19 is 3214 deaths divided by 94,250 cases which is 3.4%. This crude CFR is high: for comparison, the CFR for seasonal influenza is 0.1%. However, as I will show below, this number is not a one-size-fits all, and is influenced by many factors. Please do not look at 3.4% as an indicator of your risk of dying from COVID-19!
As I€™ve written previously, data from the COVID-19 outbreak in China we know that age has a substantial impact on CFR. Based on a summary of 44,672 cases earlier in the outbreak (published by China CDC Weekly), no child between 0-9 years of age died of infection; and in individuals less than 50 years of age, the CFR is less than 1%. Only in older individuals does the CFR increase.
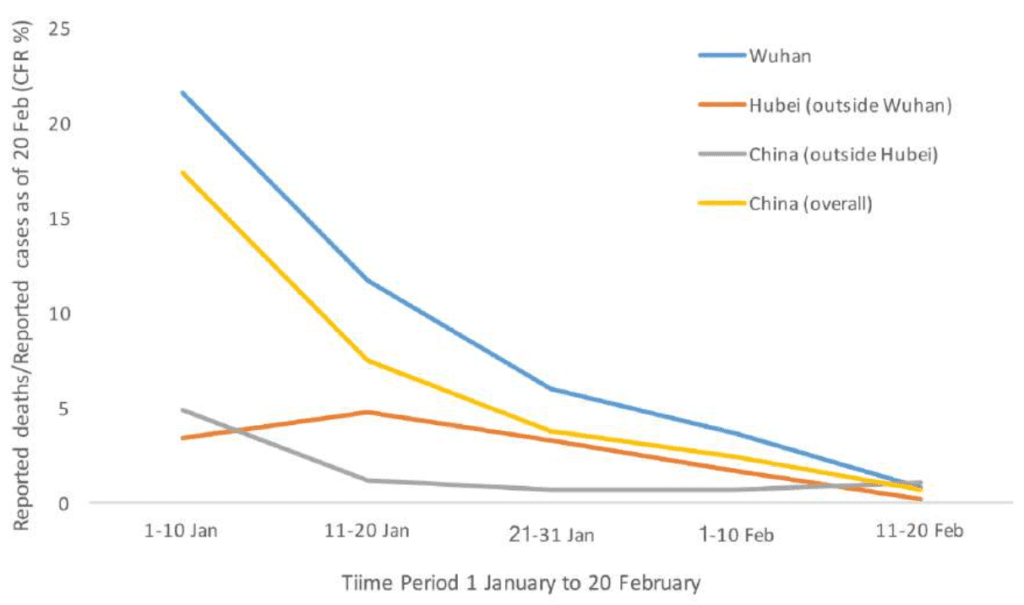
We also know that the CFR varied within China based on geographical location and even when in the outbreak the ratio is calculated. The graph included below (from the joint WHO-China mission on COVID-19 report) shows that at the beginning of January, the CFR was much higher in Wuhan than in other areas of China. This skewed CFR is due to lack of hospital care for the many infected individuals. In areas of China other than Wuhan, patients with serious disease could obtain excellent hospital care. Furthermore, the CFR declined during the course of the outbreak in China. This trend has been attributed to the evolving standard of care during the outbreak.
The CFR also varies by country, likely due to differences in the standard of care. In South Korea there have been 28 deaths among 5,621 infected individuals, for a CFR of 0.4%! In Singapore there have been 110 cases with no deaths. In comparison, in Italy and in Iran the CFR so far is 3.1%. These differences are not due to circulation of different viruses in these countries, but a combination of the quality of health care available and the age of the patients.
So far there have been 9 deaths out of 128 confirmed cases in the US, a fatality ratio of 7%. Many of these deaths have been in elderly individuals in Washington, which skews the CFR. Furthermore, it is obviously very early in this outbreak in the US. Given the overall good quality of health care in the US I suspect that the actual number will be much lower. However, if the hospitals in the US (or any other country) are overwhelmed, the CFR could be higher.
Finally, I do think that we are missing many infections, not just in China but in other countries, and therefore the CFR may be even lower. There are likely many individuals with mild respiratory symptoms (typical in the winter) who are infected but never diagnosed. Only well after this outbreak is over, when serological studies are done to determine the extent of infection, will we have an accurate CFR.
I am not attempting to minimize the seriousness of SARS-CoV-2 and COVID-19: there will certainly be many infections in the US and there will be deaths due to the infection. However, please understand that a CFR of 3.4% does not apply to everyone; what happens to you if infected depends on your age, health status, and where you live.
In early phase , the number of SARS-CoV-2 infected patient in wuhan is rapidly increased,doctor in wuhan is not enough.so many older and immuncomprised patient is died ,but now about 40 thousand doctors from other province except wuhan arrived wuhan ,I believe the CRF will be lower than now.
This analysis claims that the infection-fatality-ratio (IFR) is roughly 9.4 per 1000: https://institutefordiseasemodeling.github.io/nCoV-public/analyses/first_adjusted_mortality_estimates_and_risk_assessment/2019-nCoV-preliminary_age_and_time_adjusted_mortality_rates_and_pandemic_risk_assessment.html
It makes some good points: “Accurate estimates of the confirmed-CFR and IFR require adjust for the delays between incidence, case confirmation, and death.”
This article flags an important issue. The Diamond Princess cruise ship in Japan, which had 3,711 passengers, is perhaps a somewhat unique window as it was a “captive study population,†as it were. And pretty intensively studied in follow-up one assumes compared to the general populations elsewhere. From that ship, CNN said a week ago there were 6 deaths so far and at least 705 infected. If you take those numbers at face value, with all the caveats thereof acknowledged, the case-fatality rate is less than or equal to .0085, or less than or equal to 0.85 percent. When actual serologies get tracked eventually, it must turn out to be lower than this (almost certainly will). All of the deaths were in elderly people. As this article notes, this is a critical variable.
The denominator is the key. A Chinese CDC publication (http://weekly.chinacdc.cn/fileCCDCW/journal/article/ccdcw/2020/8/PDF/COVID-19.pdf?referringSource=articleShare) recently reported data for 72,314 cases. A high death rate early-on in Hubei province dominated initially, and subsequently the rate was lower outside Hubei. For confirmed cases diagnosed before 11 January, the rate was 15%. After 1 February, the fatality rate was 0.8%. Increased diagnostic testing may have resulted in less severe cases being roped into the denominator. For health care workers, the case-fatality rate was 0.3%. Among 214 infected health care workers outside Hubei Province, there were not any deaths. As Vincent noted, the South Korean death rate is much lower too.
In the U.S., nursing homes will be important to study, as they too are a defined population for which the entire denominator is known, there is not a lot of out-migration except for deaths, and deaths can be securely counted, plus they are a very vulnerable population and the rates will be important to know.
So just to clarify, are you saying that there is data to show that people who are below 50 WITH underlying conditions are not at increased risk compared with same age peers without underlying conditions? How specific is the data from China and other countries? Do they break it down by age and then again by underlying condition? Or is it only broken down by age, and then assumed that higher mortality among older people represents the increase in underlying conditions as people age?
We now have CFR Study from DP cruise ship, which is NOT much biased through missing cases. (They even picked up many asymptomatic cases)
https://twitter.com/epsilon3141/status/1235953311267852289?s=20
The result is very consistent with existing research
CFR= 1% to 20% depending on age.
This is, of course, assumig near perfect health care which is unlikely available in hospital-capacity straining #COVID19 outbreaks.
“the CFR for seasonal influenza is 0.1%”
This statement is not consistent with serious influenza mortality research.
There is no such thing as “official CFR” for influenza. Its statistical excess mortality.
https://link.springer.com/article/10.1007/s13524-019-00809-y
For healthy individuals “flu-cfr” is practically zero 1/100k. Flu numbers are not CFR, but statistical excess mortality in flu season, mostly age 85+ and heavily comorbid
I’m curious about the fatality ratio AND the serious injury ratio which doesn’t seem to be brought up. How many people are surviving this but are now health impaired temporarily or even permanently?
@Eric Poeschla
There are two different strains of the virus. The L and S strains. We have no clue as to what strain they have, nor at what proportions each one are spreading, nor which strain is going to win out. Historically, we also know that the virus can potentially come in waves. The first and second wave of the Spanish flu were not that deadly. The 3rd and final wave was what claimed many lives. We also need to take into account that different populations across different nations have differing co-morbidities. For instance, the US has a large population of obese people, and China has many smokers. South Korea on the other hand only has an obesity rate of 4%, whereas the US is around 36%. We still need to be very cautious about this novel coronavirus.
Good points. There is another variable at work here. How many and who get tested which varies by country and region and has varied over time. Over testing (people w/o contacts or symptoms) likely leads to many false positives as the prevalence of the disease in community is lower than the lack of specificity. Also, as tests were rushed to market based in earlier strains (we now know there is at least one other strain) the sensitivity and specificity of the tests is not well established
Putting things in perspective, China has 25,000 deaths per day of all causes and the US 7,500 per day. For younger people not confined to nursing homes or hospitals and without comorbidities, you are more likely to be in a car accident than suffer any great discomfort from this virus
Understood. Not meant as an official CFR, but the number being thrown about in the press, and to which people are comparing COVID-19.
Thanks to the efforts of the CDC, NIH & others to bury the history and evidence
of “Chronic Fatigue Syndrome”, most people never heard that the first name for the “mystery malady” was
“The China Flu”
https://youtu.be/OYGIX4iw6Uw
Korea seems to be incorporating new antivirals into standard treatment protocol which may further improve outcomes there:
http://www.koreabiomed.com/news/articleView.html?idxno=7428
@”These differences are not due to circulation of different viruses in these countries, but a combination of the quality of health care available and the age of the patients.”
You don’t know that, you can’t prove that, and you don’t have any evidence for that. We know this virus has mutated and the genomes submitted by different countries prove this. We know that mutations within the core or the spike proteins can cause significant differences in host tropism and severity of the disease. You’re downplaying the numbers, you’re assuming too many things and stating opinions as if they are facts, and you’re doing the math wrong as well.
The numbers from China are fabrications. The current case fatality rate in Italy is over 27%.
Eric Poeschla has pointed at the most reliable estimate so far of the CFR by relying on the case of the Diamond Princess (7 deaths so far for 705 infected or a ratio of about 1%). This is an excellent sample as all on board have been tested and there has been quite some time since the contamination, so the number of fatalities is becoming more or less definitive. Hence, we know with great precision both the numerator and the denominator unlike estimates used in China or elsewhere giving us the best CFR that there is.
Unfortunately, many who those work on the CFR may be good in virology, they are unfortunately not good at statistics. If they were, they would understand that the sample is biased because of the high ratio of older folks in the sample (such cruises are famous for their sheer number of retirees) and therefore it is not representative of the larger population out there that could be infected. The higher ratio of older folks onboard skews the CFR to the high side of its true value because of the much higher CFR for older folks than for younger folks. In other words, the 1% Diamond Princess CFR is with certainty much higher than the general population CFR, all else equal (quality of care, early detection, etc…). It is an upper bound only. The true value is below that.
Question from “hotspot†Seattle…How likely is it that Seattle has, truly, way more cases of Covid-19? It hit the nursing home with lots of vulnerable people, and then we finally could test them. If it hadn’t hit that nursing home, testing would be less, there would be fewer confirmed cases, and our numbers would look much better. But all the while this virus has been circulating. I’m having a hard time phrasing this. I’m wondering if all major (west coast?) cities have roughly equal amounts of covid-19 circulation, but lack of tests/high bar for testing means that other cities just don’t yet know it. I had a person from Hawaii tell me how amazed they are that there are no covid-19 cases in Hawaii, despite the high number of Asian tourists. I haven’t checked to see if it is true that Hawaii has no confirmed cases, but again, even if true, isn’t there a pretty good chance the virus is circulating there?
Sorry for the confusing wording and random speculations. Thank you for the straightforward information here and on TWiV, too. It is so helpful to me.
Latest translation of Chinese treatment protocols using antivirals right now:
4. Antiviral therapies: Interferon-alpha (adult: 5 million units or equivalent can be added to 2ml sterile injection water and delivered with a nebulizer twice daily), lopinavir/ritonavir (adult: 200mg/50mg/tablet, 2 tablets twice daily; the length of treatment should not exceed 10 days), ribavirin (recommended in combination with interferon or lopinavir/ritonavir, adult: 500mg twice or three times daily via IV, the length of treatment should not exceed 10 days), chloroquine phosphate (adult 18-65 years old weighing more than 50kg: 500mg twice daily for 7 days; bodyweight less than 50kg: 500mg twice daily for day 1 and 2, 500mg once daily for day 3 through 7), umifenovir (adult: 200mg three times daily; the length of treatment should not exceed 10 days).
https://www.chinalawtranslate.com/en/coronavirus-treatment-plan-7/
Do we know how patients in the US are being treated?
>Finally, I do think that we are missing many infections, not just in China but in other countries, and therefore the CFR may be even lower. There are likely many individuals with mild respiratory symptoms (typical in the winter) who are infected but never diagnosed. Only well after this outbreak is over, when serological studies are done to determine the extent of infection, will we have an accurate CFR.
Can you explain the evidence for that? In the WHO report, the team went back tested 320,000 samples originally taken for flu and other screening and only 0.5% returned positive. 0.5% of the samples that they were already testing for flu, this does not imply a huge iceberg of undetected cases.
Assuming the most optimistic scenario here seems like a dangerous assumption. Let’s hope it’s true but plan for the case where isn’t.
It is wrong to base the CFR on the total number of cases, for the simple reason that many of those cases are still in hospital and could therefore go either way, ie, recover from the disease or succumb to it.
I base the CFR on the ratio between the number of recovered cases against those that have died.
These are the current death rates from top most infected countries.
This is calculated by adding together the number of those recovered and those that have died. This figure is then divided by 100 times the number of deaths to give the percentage death rate.
China (mainland) 19016 5%
Italy 7985 39%
South Korea 7307 31%
Iran 4530 9%
France 1375 71%
Spain 1168 48%
Germany 1131 10%
USA 552 73%
Japan 418 18%
Switzerland 369 40%
Netherlands 318 100%
United Kingdom 297 22%
Thes figures could of course come down as more cases recover, but it gives a true indication of the current death rate. You will notice that these figures are much higher that the original cases in countries bordering China. There is a different, (probably mutated) strain sweeping across europe and it is a far more potent killing machine than the original virus in China.
During the early days of the Chinese outbreak the number of recoveries was always much higher than the number of deaths. That is not happening in Europe at the moment, which proves this is a totally different, or mutated strain. strainNVER exceeded the
If detection methods are ineffective the ratio of fatalities will always appear high. The lowering ratio in China is due to improved detection. Some 80% are not severe cases and easily recover (check out the Lancet medical journal not News Daily sensationalism).
Pingback: SARS-CoV-2 coronavirus case fatality ratio – Virology Hub
The lowering ratio in China is due to improved detection, as another commenter has said. Improving care is probably a part of this too. To me, this rapid decline and then settling of the rate indicates that there probably aren’t that many cases flying under the radar.
As the epidemic in China slows down, the ratio has begun to increase. As it should because it is getting closer to a “true” or final ratio. It is a bit sneaky that you only plotted data to 20 February when this ratio began increasing again (sorry!)
Last criticism: you stated “Given the overall good quality of health care in the US I suspect that the actual number will be much lower.”
The high death rate in the US, to me, is actually emblematic of the fact that US health care is incredibly poor compared to China, South Korea, Italy and Japan. FYI. People aren’t getting diagnosed unless they are on death’s door.
Agree with above me^
after accusing others countries being non-transparent or cooking-up the numbers now reality show… hahahaha karma is the bitch!
It even worrisome for US cause instead of forming an epicenter it detected everywhere.
Pingback: How many deaths caused by SARS-CoV-2 will there be in the US?
How does the new coronavirus compare with the flu
The new coronavirus outbreak has made headlines in recent weeks, but there*s another viral epidemic hitting countries around the world: flu season. But how do these viruses compare, and which one is really more worrisome?
read more about this https://www.afterviral.xyz/post/How-does-the-new-coronavirus-compare-with-the-flu/0
An outstanding share! I’ve just forwarded this onto a colleague
who was doing a little research on this. And he in fact
ordered me lunch due to the fact that I stumbled upon it
for him… lol. So allow me to reword this…. Thank YOU for the
meal!! But yeah, thanks for spending the time to
discuss this issue here on your website.
Pingback: Trump’s Deadly Mistake in Comparing Coronavirus to Flu - G20 Intel
Pingback: خطأ ترامب القاتل ÙÙŠ مقارنة الÙيروس التاجي بالإنÙلونزا - آخر الأخبار Ø
Pingback: Trump's Deadly Mistake in Comparing Coronavirus to Flu - Ask Your Family Doc
Pingback: Trump’s Deadly Mistake in Comparing Coronavirus to Flu – The Intercept – Corona Virus News
Very useful article, thanks for writing such an information piece.
We would like to take your graph & share it in our website “https://www.coronavirusncov.in” for knowledge purpose.
If you are OK with it please let us know. We thank you for your contribution
we have tried writing a formal email but it is bouncing back our Coronavirus related Website!< & email id is albertweeeng@gmail.com
Thank you
Pingback: University of Minnesota research center misrepresents COVID-19 study to double death rate | The College Fix