
Yesterday many US newspapers carried front-page stories on the severity of influenza so far this season. The New York Times story began with “It is not your imagination,more people you know are sick this winter, even people who have had flu shots.” Is this really a bad flu season?
Before we answer that question, I would like to complain about what the Times wrote: ‘more people you know are sick this winter, even people who have had flu shots”. A similar sentiment appeared in a recent Forbes column “Influenza-like-illness is sweeping the country with the Centers for Disease Control & Prevention reporting that most areas of the country experiencing high rates. I should know, my family is in the midst of it despite having been vaccinated.”
Remember that having a respiratory illness does not mean that you have influenza – it could be caused by a number of other viruses which of course would not be blocked by influenza vaccine. Furthermore, the influenza vaccine is not 100% effective – it’s about 60-70% effective in individuals younger than 65 years. That’s not great, but it is better than having no vaccine. The point that I want to make is that it is not useful for anyone to relay anecdotal information about immunization and infection unless you know for sure that you had influenza virus. It only further discourages widespread immunization, which is already isn’t where it should be (~40%).
To answer my question – is this a bad flu season? – I looked at data from the Centers for Disease Control and Prevention, which receives thousands of respiratory specimens from laboratories throughout the US and determines if they contain influenza virus, and if so, which subtype. Here are the results through week 1 of January 2013:
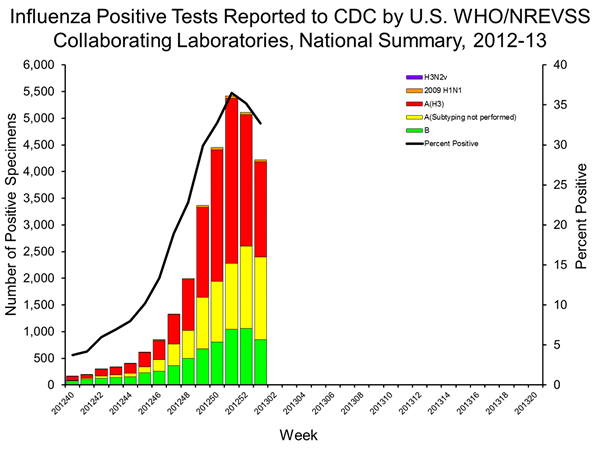
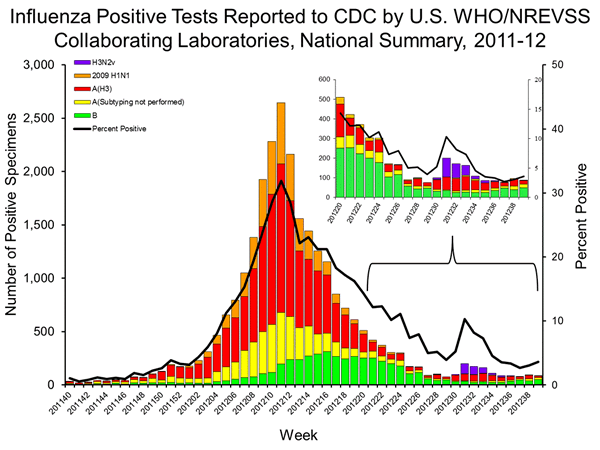
According to these data, there was a peak of influenza activity in week 51 (December 2012). This is early compared with recent influenza seasons. In the 2011-12 season, influenza activity peaked in week 11 (March) of 2012:
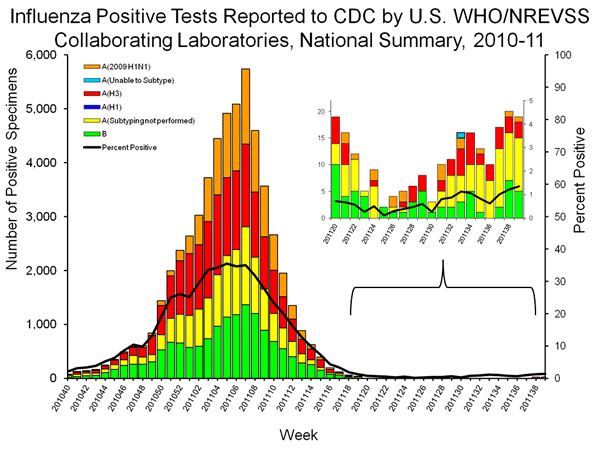
During the 2010-11 season, the peak of influenza activity was week 8 (February) of 2011:
During the 2009-10 season, the peak of influenza activity was quite early, in week 42 (October) 2009:
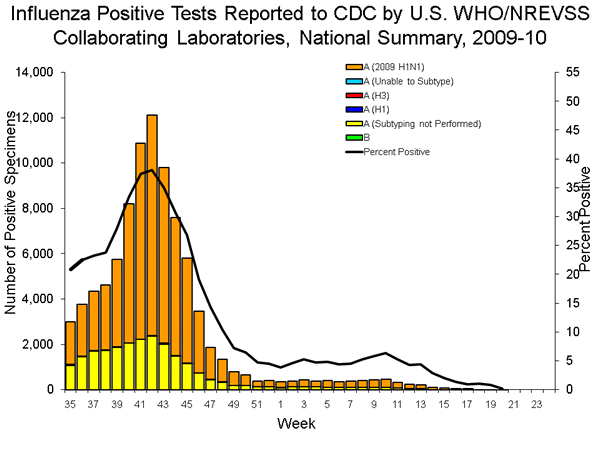
The number of diagnosed infections each year is also indicative of the extent of the influenza season. So far in the 2012-12 season there have been 28,747 influenza positive specimens. Numbers in the previous years: 157,449 in the 2009-10 season, and 55,403 in the 2010-11 season (I was not able to locate totals for 2011-12).
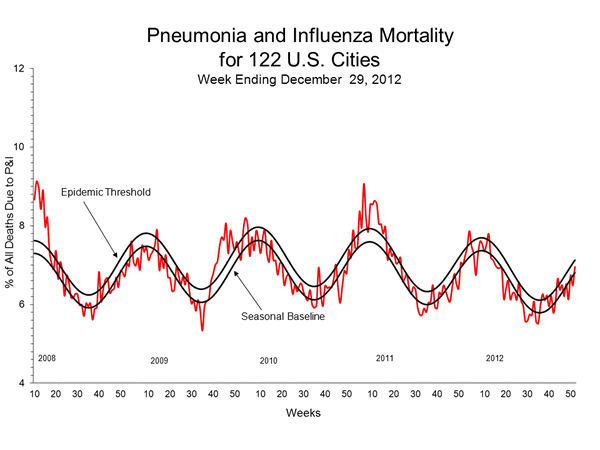
Pneumonia and influenza mortality has so far not substantially exceeded the epidemic threshold as it has in previous years:
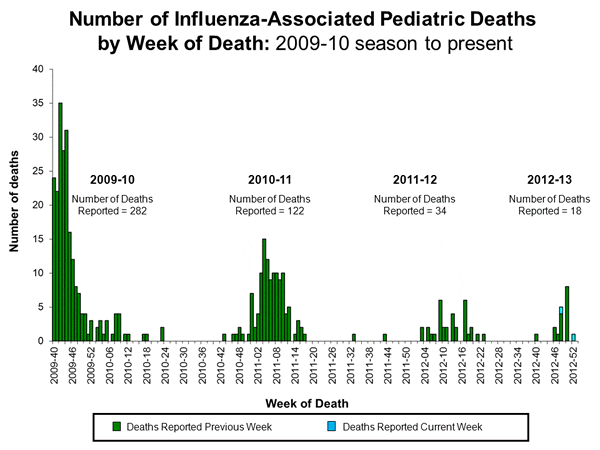
Pediatric deaths from influenza are on track to exceed last year’s total but not the previous two years:
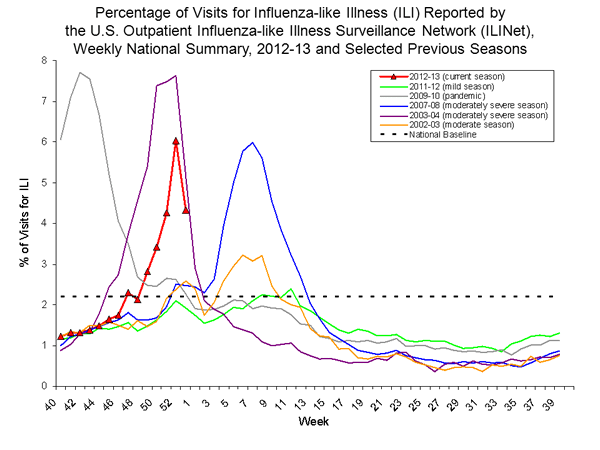
The percentage of outpatient visits for influenza-like illness (based on symptoms, not virus isolation) is following a pattern that resembles recent moderately severe influenza seasons:
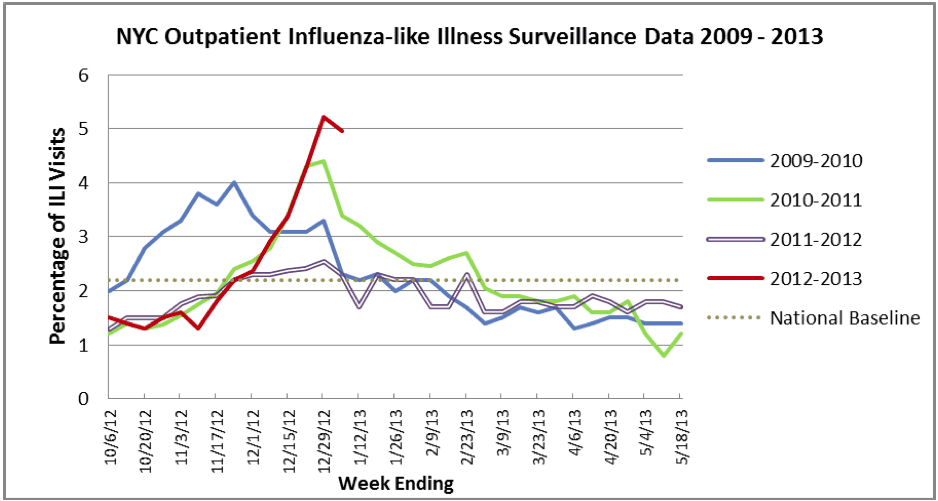
The New York City Department of Health and Mental Hygiene also monitors influenza and produces weekly summaries during the season. One metric they report is the percentage of visits for outpatient influenza-like illness. The curve resembles that for 2010-11:
New York City also identifies what type of respiratory virus is associated with influenza-like illness, including influenza viruses, adenovirus, respiratory syncytial virus, parainfluenza virus, and metapneumovirus. For week 1 of 2013 all isolates (n=45) were either influenza A/H3N2 or B, although analysis of about a third of them is pending. In previous weeks a mix of other viruses were found in addition to influenza.
Note also the prevalence of influenza H3N2 this season, which has largely displaced the 2009 pandemic H1N1 strain. The H3N2 subtype is generally associated with more severe influenza seasons.
In summary: the data so far suggest that influenza activity is peaking early than in the past two years, but not at an unprecedented time. Numbers of infections, pneumonia, and mortality, are not off the charts. I would agree with Jean Weinberg, a city health department spokeswoman, who said “This is not a season that is out of the ordinary, though H3 seasons tend to be worse than H1 seasons”.
Another excellent summary of current events by Dr. Racaniello! I have heard nothing but how awful this flu season is supposed to be from various media outlets. However, they all seem to be based on anecdotal evidence, rather than the cold hard data. Thank you once again Vincent for your excellent blog and podcasts. The world needs more scientifically literate citizens.
Some news reports tell us that if you have been vaccinated and get the flu it will not be as strong a case of flu as it would be if you had not been vaccinated. Is this accurate? If this is accurate does the degree of partial protection depend on which of the three viruses the vaccine targets infects you? My grand child has type 1 diabetes and so flu season is particularly scarey for our family and this idea of partial protection would offer some additional comfort if it is factual. Thank you.
You’re splitting hairs on the definition of “ordinary” and glossing over some important considerations. Maybe this season isn’t top 5% for flu morbidity since 1968, but it’s probably in the top 10% and certainly in the top 20% (talking only about N. America). There’s a new antigenic variant (A/Victoria/…/2011) that N. America hasn’t been exposed to–and rumor suggests some fresh drift within it–and immunity from natural infection is perhaps even lower than usual due to meager flu incidence last year. I think it’s especially striking that the epidemic is so bad considering the high vaccination rates (by flu standards) relative to 2003-4, when a roughly analogously bad cluster jump occurred. (It would help if the CDC released detailed HI data so we could know what we’re dealing with phenotypically!) We don’t know that vaccination rates are actually 40% right now–138 million vaccines have been distributed, but I’m pretty sure that’s at the pharmacy/hospital level, not the individual, and some nontrivial fraction are probably redundant to infection acquired soon after receipt. You’ve also overestimated efficacy and confidence; CDC reported yesterday that H3N2 VE for the TIV is closer to 55% (based on an early-season, potentially less antigenically diverse viral population), but the CI are *huge*. You’re also forgetting that flu transmission is often disrupted over the holidays, so we should wait another week or two before talking about inflection points.
Forgot to mention that PCV7 and PCV13 are contributing to lower flu morbidity and mortality generally, which means that it’s not completely appropriate to compare ILI and hospitalizations from this season to much older seasons (without some rescaling) if we’re trying to make conclusions about flu incidence.
google flu trends numbers keep going up, CDC numbers are down a lot
now
ISDS no longer collects data
see my charts here : comparing with 1999,2003
http://www.flutrackers.com/forum/showthread.php?p=478766
btw. 26394 positives in 2011/12 so far – they keep testing…
mortality is surprisingly low, very unusual for H3
Vincent, here is some info to fill in one of the gaps you mention re: the number of positive influenza specimens submitted to CDC during the remarkably mild 2011-2012 flu season:
If I used the CDC’s Xcel spread sheet correctly, downloaded from http://gis.cdc.gov/grasp/fluview/fluportaldashboard.html , there were:
26,748 positive isolates in 2011-2012, not including the H3N2v cases
27,012 positive isolates in 2011-2012, including the H3N2v cases.
You can download this data from the dashboard at:
http://gis.cdc.gov/grasp/fluview/fluportaldashboard.html
Choose season 2011-2012
Download data labeled “Influenza Positive Tests Reported to CDC, National Summary, 2011-2012 Season through Sep 29, 2012â€
Then use the resulting Xcel spread sheet to add up the positive specimens.
One other point I have teased out, while trying to see if there is a correlation between early onset and severity:
Of the two LATEST onset flu seasons in the last 30 years:
One was one of the the mildest seasons on record (2011-2012).
The other was a season of moderate severity (1987-1988).
(Data re: latest onset flu seasons from http://www.cdc.gov/media/haveyouheard/stories/flu_activity_increasing.html )
(Data re: 2011-2012 being either the mildest flu season on record, or the mildest season since 1980-81, from: http://www.cdc.gov/washington/fluBrief/ebrief_06-2012.pdf )
(Data re: 1987-88 being a flu season of moderate severity from Table 2 of Lone Simonsen’s (et al) article at: http://www.ncbi.nlm.nih.gov/pmc/articles/PMC1381234/pdf/amjph00511-0042.pdf )
Is it possible that more people going to the ER than in previous other years?.
Is it possible that more people are going to the ER when they have influenza symptoms than in previous years?
the interesting thing is NJ has had flu vaccine mandates for several years now and never has lower rates of reported or documented influenza as compared to other states in it’s CDC designated region. The proof is in the pudding. the term effective is actually afficacy as flu vaccines are not tested for effectiveness. efficacy is how many recipients mount an antibody response but this doesn’t necessarily correlate with immunity.
sorry, I meant efficacy
I never worry about the flu anymore…as I have been taking MMS (Chlorine Dioxide) for over 5 years now. It kills all viruses and bad bacteria, and the FDA is trying to ban it,s use , as it may cost Big pharma to much money if every one was using it to keep their bodies healthy.
I’ll tell you I had gotten a virus from my brother a few years back and I took 15 drops 5 times in one day and the virus was gone the next day, where my brother languished on for 3 months with that sickness. Look up MMS on the internet and get some and keep yourself safe from sickness or go here www,jimhumble.biz
Clearly you are not familiar with the higher incidence of type 1 diabetes in relation to vaccines! When I got type 1 diabetes I never got another vaccine again!! Like the guy said, the flu vaccine is only 60% effective. That does not mean 60% of those who take the vaccine are protected…the number is actually derived by considering those who got vaccinated and got the flu and those who got vaccinated and got the flu. Then they compare the two numbers…Note, he said in people UNDER 65. Seemingly getting the flu shot actually causes more flu in active seniors over 65…that’s why he didn’t mention it.
Typo “…the number is actually derived by considering those who those who DID NOT GET vaccinated and got the flu and those who got vaccinated and got the flu. Then they compare the two numbers” Its actually quite an insignificant difference when you think of it, plus the small difference is more likely explained because people who get flu shots also wash their hands and are more proactive in preventing the flu by other well known means. Having type 1 diabetes I want to be as well protected as I can so that when I get old I will not get a silly cold and die. The only way to get that long term lifelong protection is by getting full exposure to the pathogens the way our bodies were made to handle them naturally! I hope I get the flu so I am protected from getting it in the future when I may not be as healthy. Once coming down with the flu, I will have antibodies to not just this flu, but several strains of the flu. On the other hand, if I get the shot, I have a small chance of developing antibodies to only one SINGLE strain. And the risk! It is absolutely not worth it! Not only that but the wortheless ‘protection’ it provides only lasts a short time. The flu strains come back around every 50 years or so…by then I won’t have those antibodies anymore and I will die from having gotten the damn flu shot! That is, if the shot itself doesn’t kill me.
I appreciate your views.
Every year I always get the flu. I was so sick I did not want to leave my bed over New Years. Now a days you have to wait days to get in to see a doctor and the ER cost thousands of dollars. I was so grateful I had this MD247 service. All I did was pick up my phone to talk with a doctor. I didn’t leave my bed until I went to CVS to pick up my prescription. Flu